3. Network Security & Intrusion Detection (IDS)
📅 Published: 2026-04-13 22:33 | 🔄 Last Updated: 2026-05-16 01:50
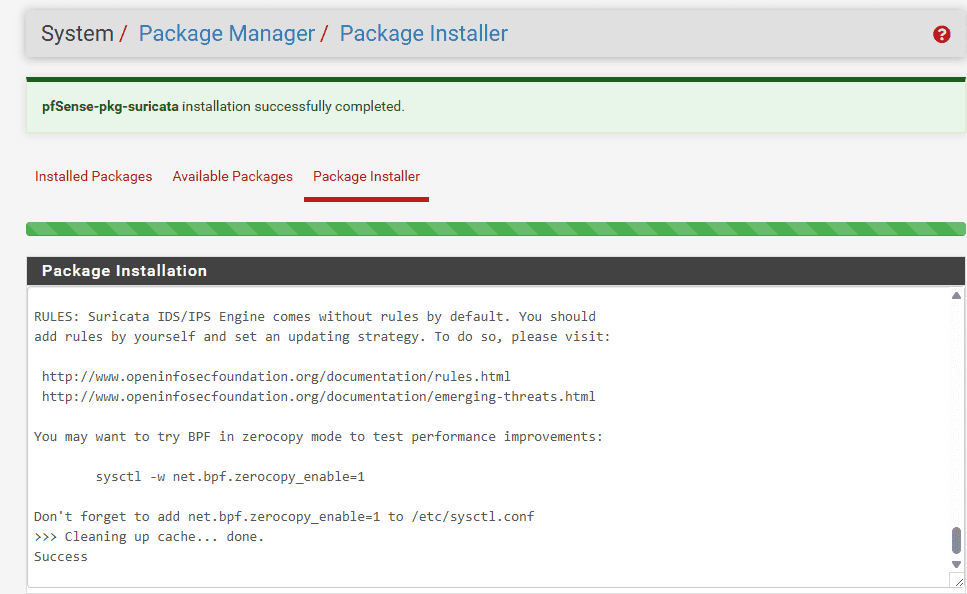
1. Installing Suricata on pfSense
1.1. Package Installation:
- Log into pfSense.
- Navigate to System → Package Manager → Available Packages.
- Search for Suricata and click Install.
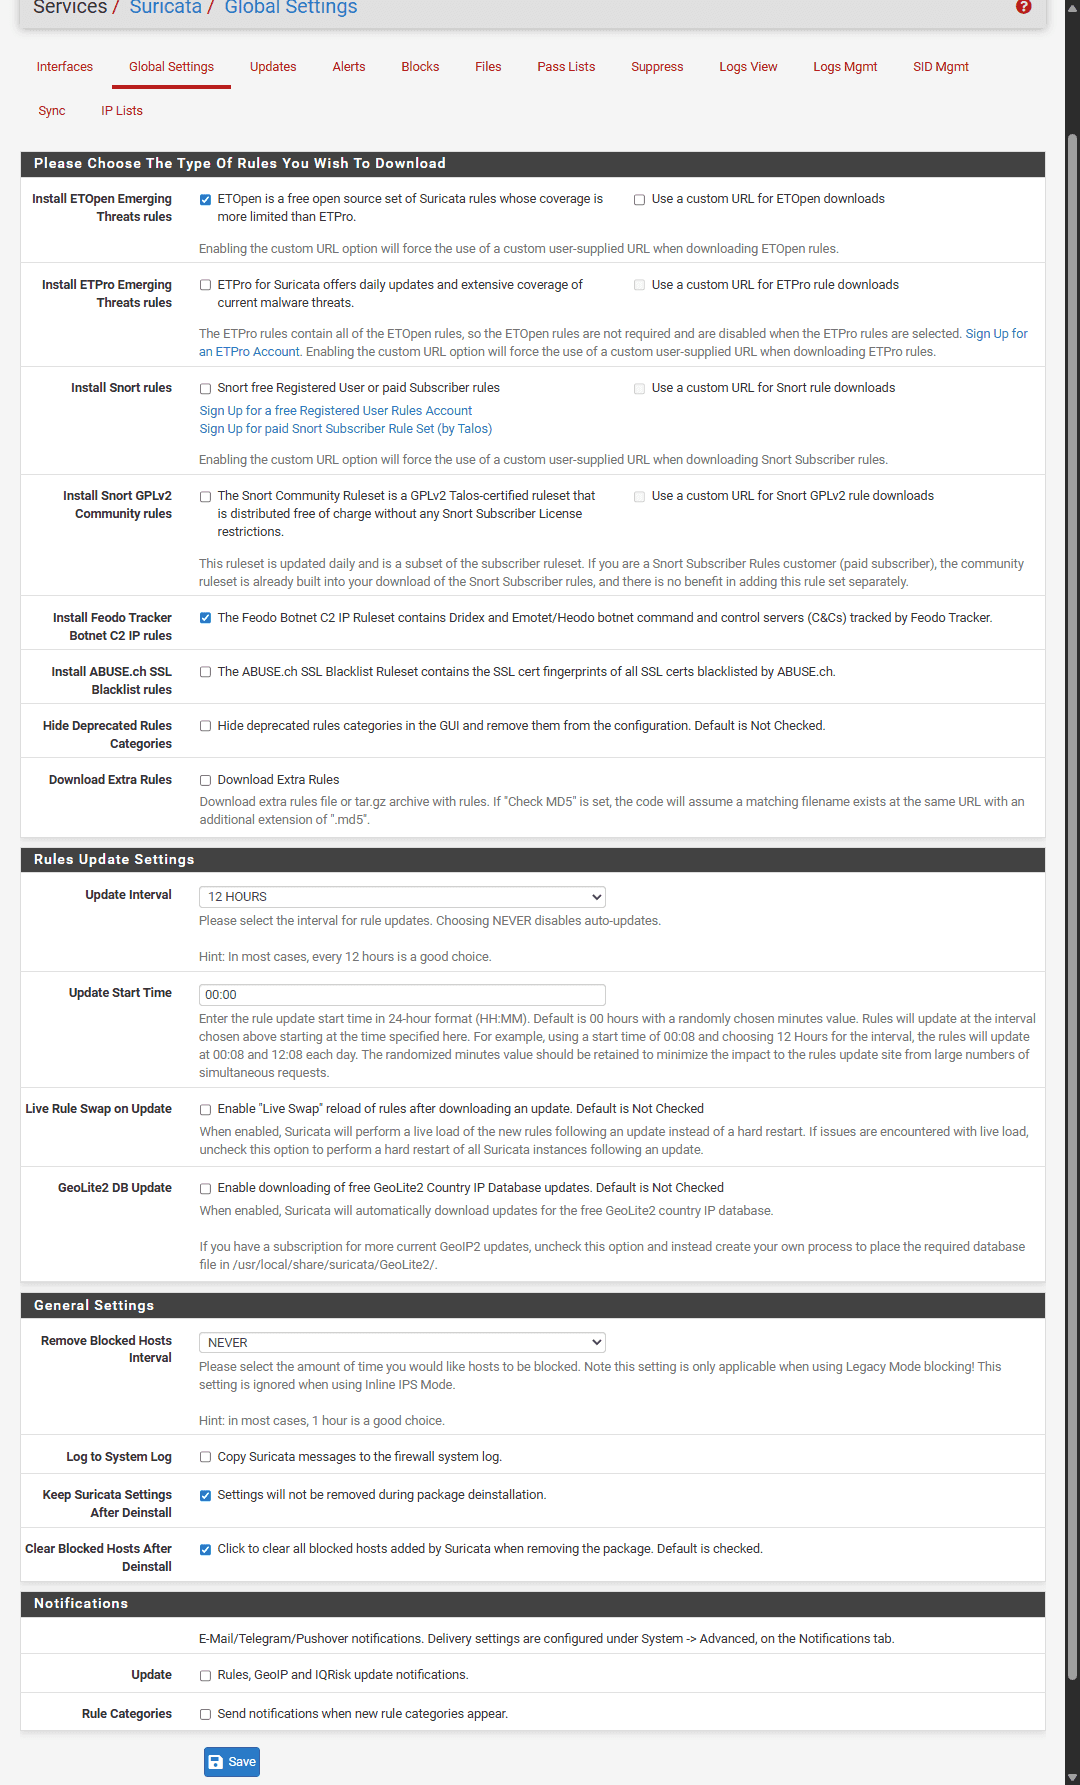
Configuring Global Settings (Downloading Rulesets):
- Navigate to Services → Suricata → Global Settings.
- Under the Rules Update Settings section, check the box for:
Install Emerging Threats rules (ET Open)
- Set the Update Interval to 12-Hours.
- Save the configuration, then switch to the Updates tab and click Update to force an immediate download of the rulesets.
1.2. Attaching Suricata to the LAN Interface:
- Switch to the Interfaces tab and click Add.
- Interface: Select LAN (This is the network segment containing DC01 and WS01).
- Under the Alert Settings section: Check Send Alerts to System Log.
- Additionally, enable EVE JSON log: This is the standard log format required for seamless ingestion into Splunk.
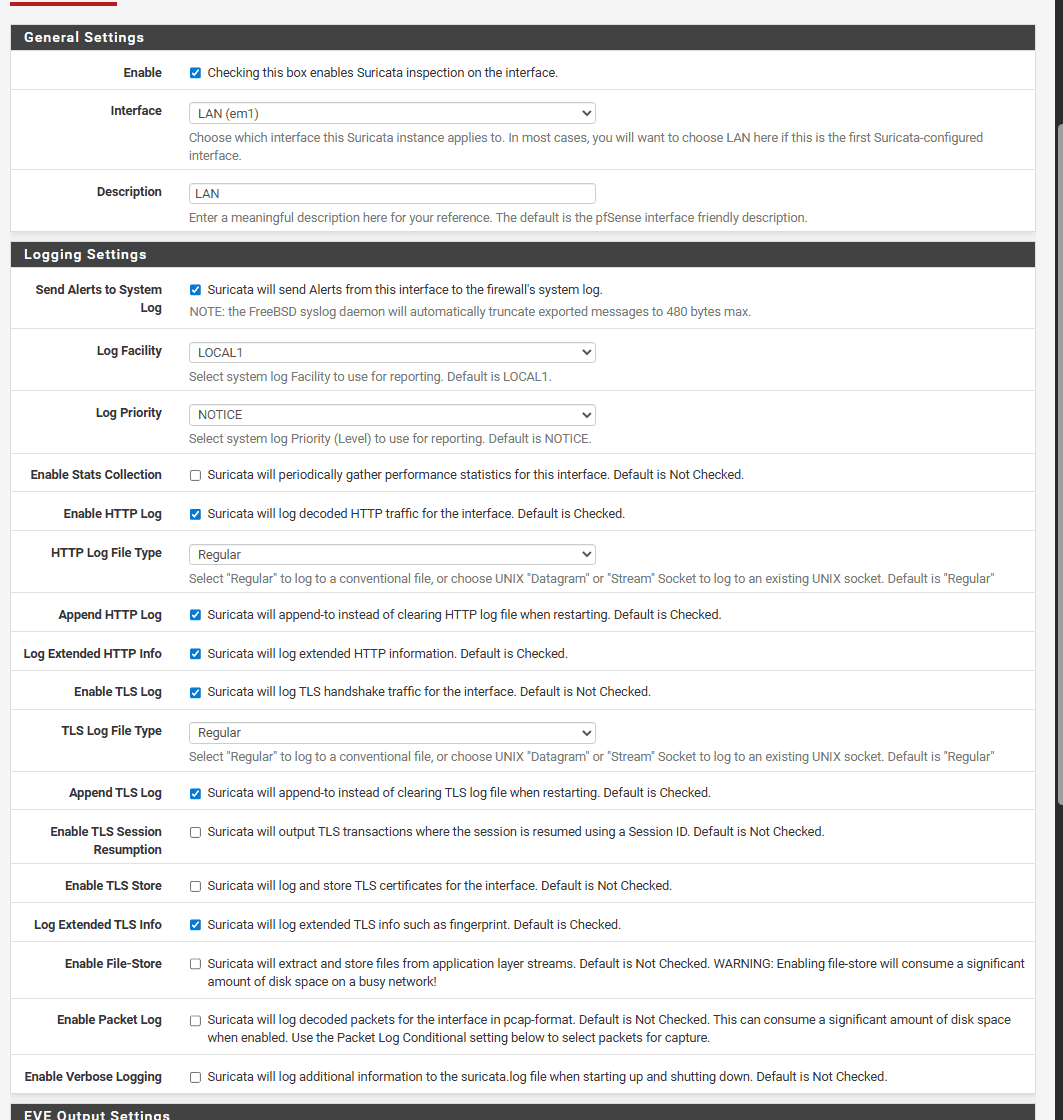
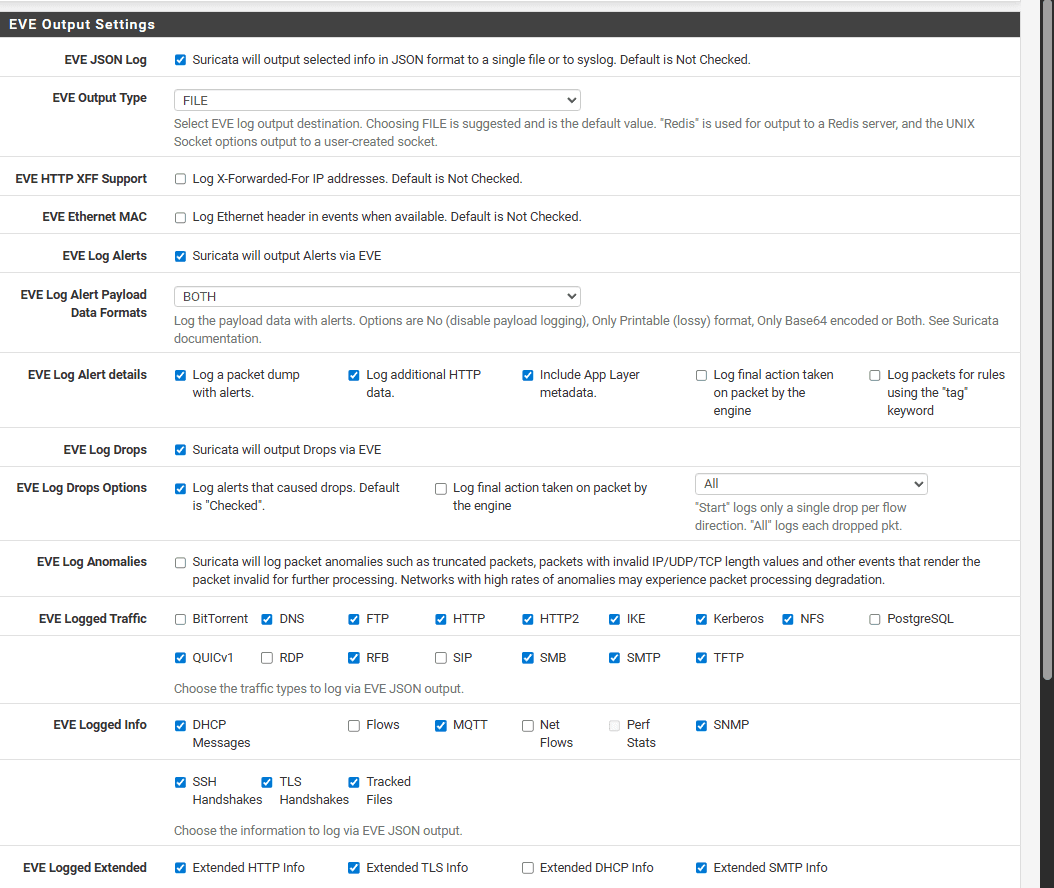
- Save the configuration.
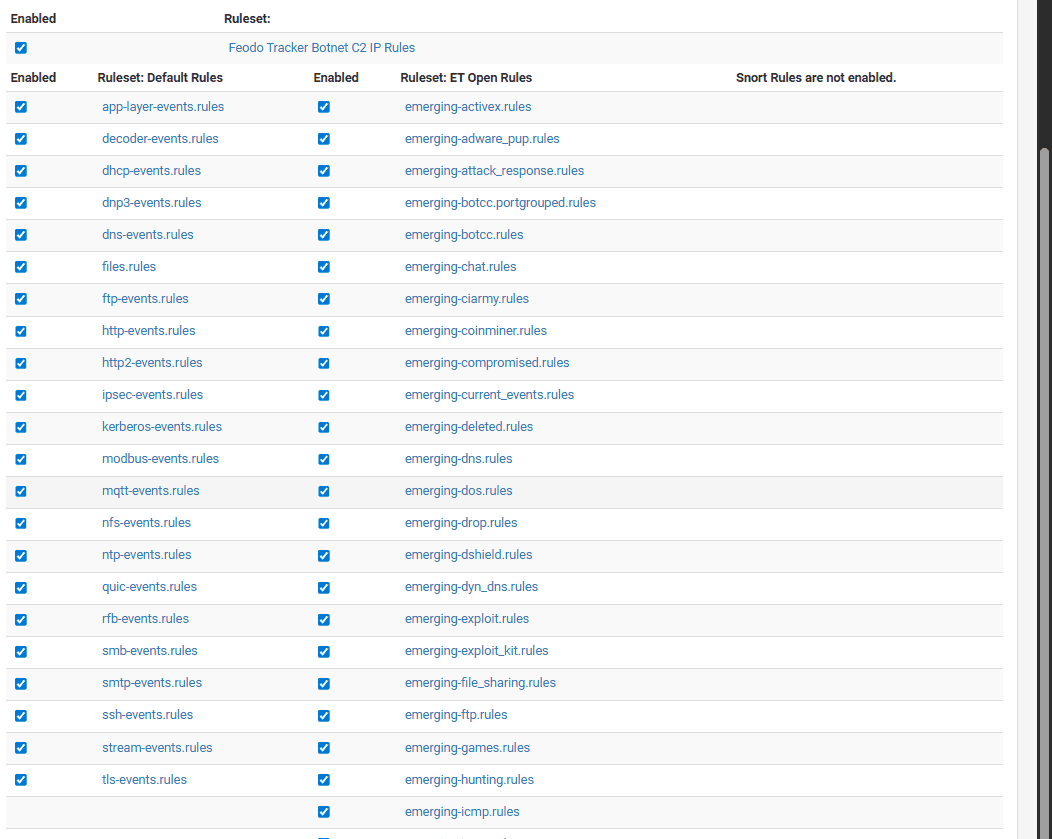
- Switch to the LAN Categories tab and click Select All to enable all the recently downloaded rules (Note: These can be fine-tuned later to reduce noise and false positives).
- Return to the Interfaces tab and click the Play icon to start the Suricata service on the LAN interface.
2. Configuring Log Forwarding from pfSense to Splunk
Instead of installing the Splunk Universal Forwarder directly on pfSense (which is highly complex and prone to breaking), we will utilize the traditional syslog-ng service.
2.1. On pfSense (Configuring syslog-ng)
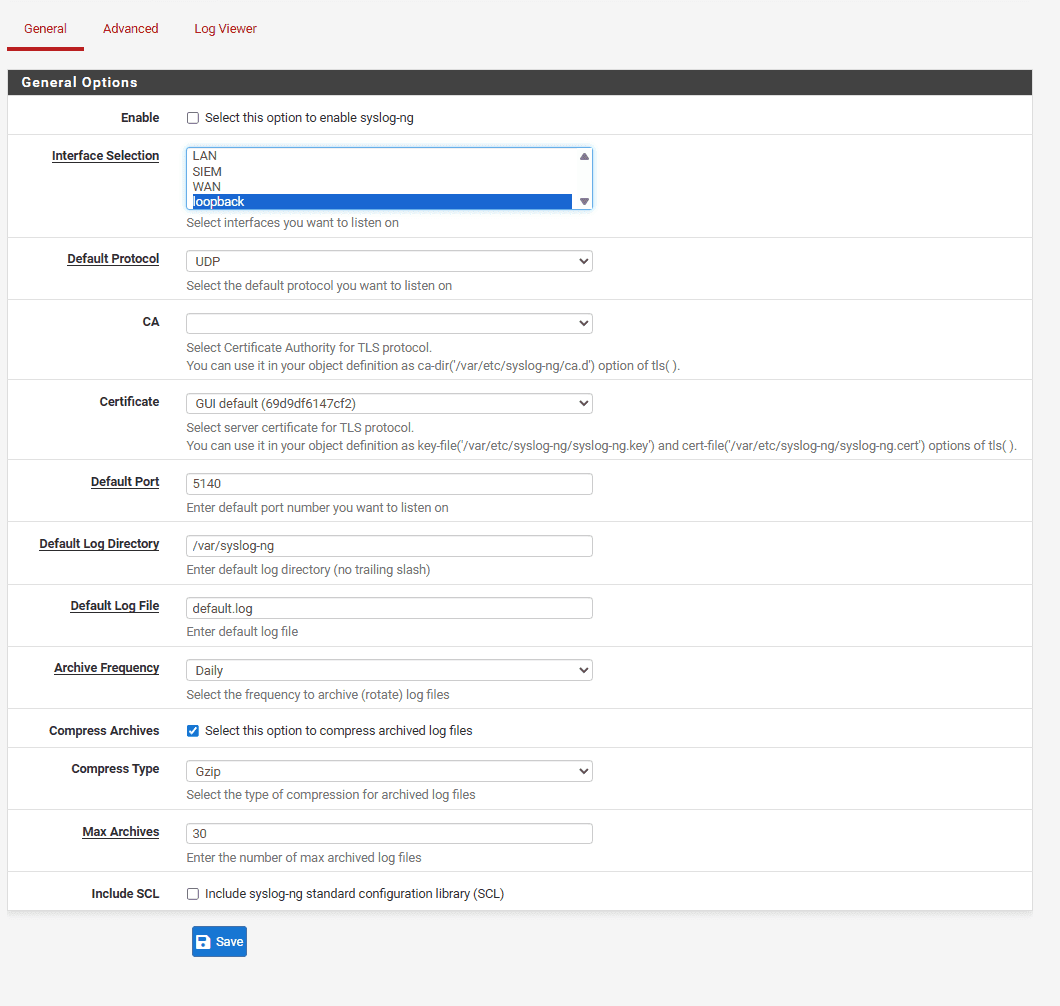
- Leave the General Options at their defaults as we do not need to modify this section. Selecting
loopbacksimply instructs the service to listen on its own internal interface.
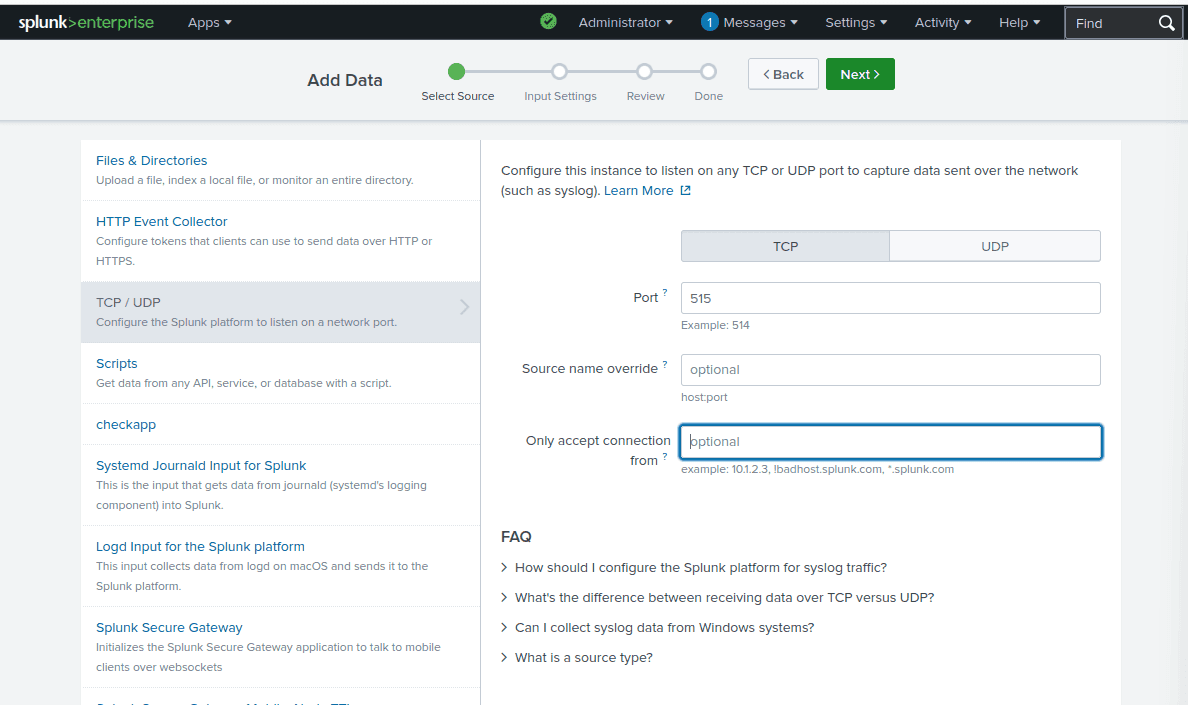
Method 1: Using TCP Port 515 (Deprecated)
- In Splunk, navigate to Settings → Data Inputs.
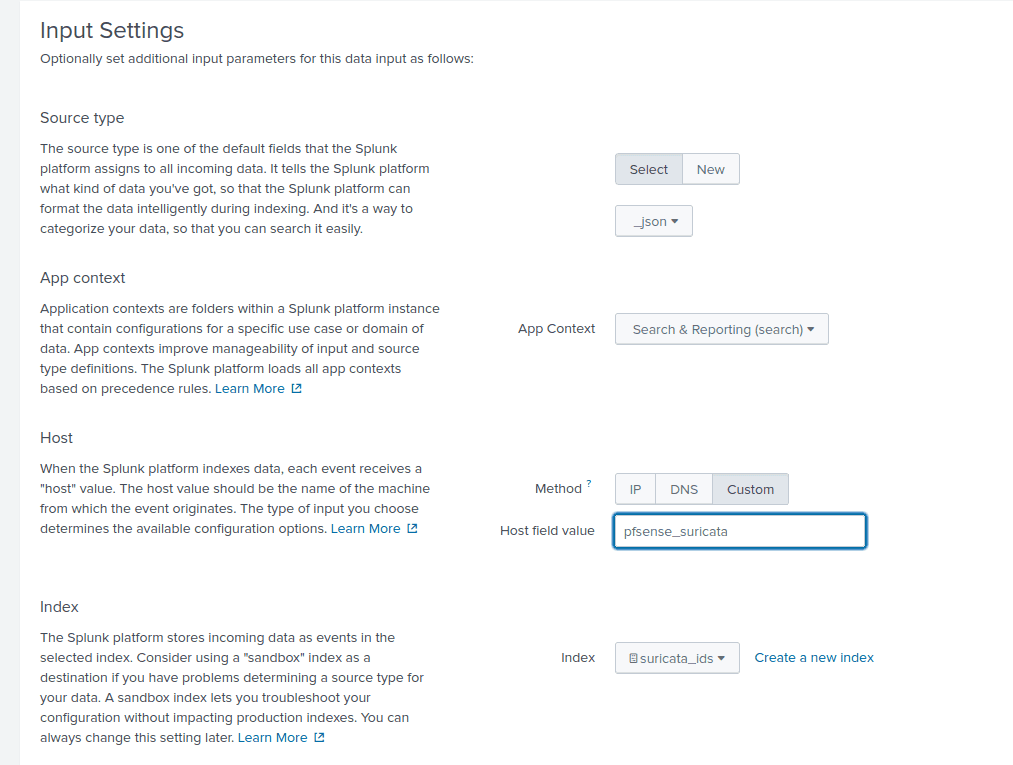
- During the configuration step (Set Sourcetype), you must select
_json(located under the Structured group). This configuration allows Splunk to accurately parse and extract the JSON fields immediately upon ingestion. - Note: When initially deploying your Splunk Docker container, you must ensure port 515 is exposed.
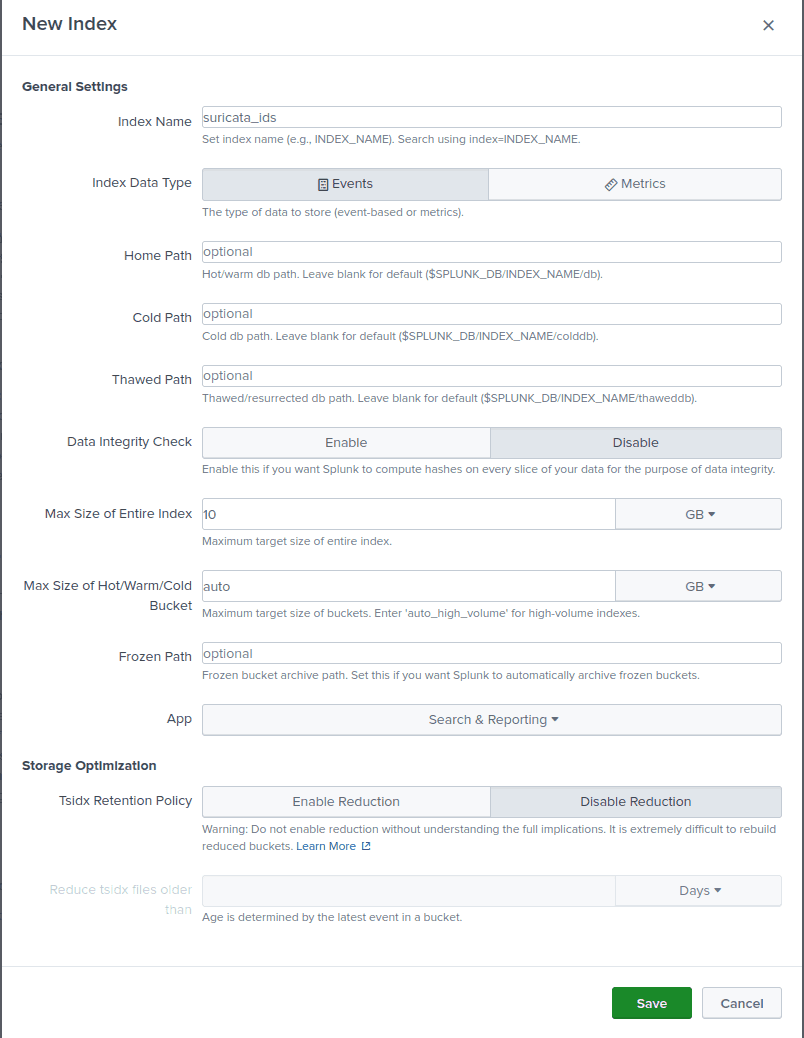
Create a new index named suricata_ids and assign the host value as pfsense_suricata.
Method 2: Using HEC (HTTP Event Collector) for highly efficient log parsing
https://www.unsafehex.com/index.php/2023/10/11/forward-pfsense-suricata-splunk/
Step 1: Enable the HEC Port on Splunk First, we need to open port 8088 and generate an authentication Token to grant pfSense the required permissions to push data.
- On the Splunk Web interface, navigate to Settings → Data Inputs → HTTP Event Collector.
- In the top right corner, click Global Settings → Select Enabled → Click Save.
- Click the green New Token button:
- Name: Set this to
suricata_hec. - Click Next.
- Index: Create a new index named
suricata. - Click Review → Submit.
- Name: Set this to
- Securely copy and save the generated token.
Step 2: Create Source, Destination, and Log Mappings on pfSense Open pfSense, navigate to Services → Syslog-ng → Advanced tab. You will click Add consecutively to create the following three configuration Objects:
1. Source Object (Reads the eve.json file directly):
- Object Name:
s_suricata_eve - Object Type: Source
- Object Parameters:
{wildcard-file( base-dir("/var/log/suricata/") filename-pattern("eve.json") recursive(yes) flags(no-parse) ); };

2. Destination Object (Forwards to Splunk HEC):
- Object Name:
d_splunk_hec - Object Type: Destination
- Object Parameters: (Copy the code block below, ensuring you replace the IP address with your Splunk IP and the password field with the Token you generated in Step 1):
{ http(url("https://10.10.20.30:8088/services/collector/event") method("POST") user_agent("syslog-ng") user("user") password("REDACTED") peer-verify(no) body("{ \"time\": ${S_UNIXTIME}, \"host\": \"${HOST}\", \"source\": \"suricata\", \"sourcetype\": \"_json\", \"index\": \"suricata\", \"event\": ${MSG} }\n") ); };
Note: The password value is the exact token string generated when you configured the HEC input on port 8088 in Splunk.
- Log Object (Links the Source to the Destination):
-
Object Name:
l_suricata_to_splunk -
Object Type:
Log -
Object Parameters:Plaintext
{ source(s_suricata_eve); destination(d_splunk_hec); };
Step 3: Restart Services
Navigate to Status → Services in pfSense, locate both the syslog-ng and suricata services, and restart them to apply the new configurations.
2.2. System Verification
Triggering an Alert: Run the following command from your workstation (WS01):
PS C:\\Users\\cuong_nguyen> curl <http://testmyids.com>
uid=0(root) gid=0(root) groups=0(root)
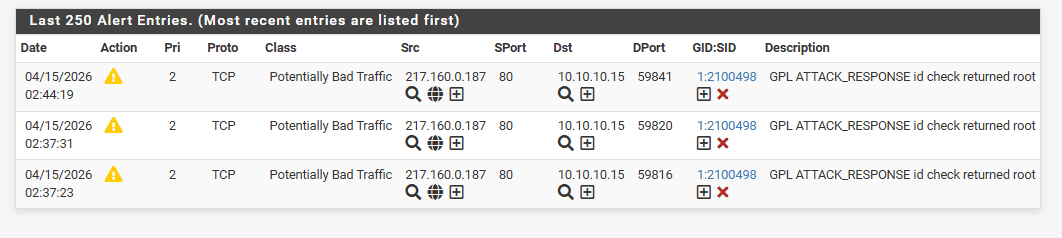
Verification on pfSense:
- Navigate to Services → Suricata → Alerts.
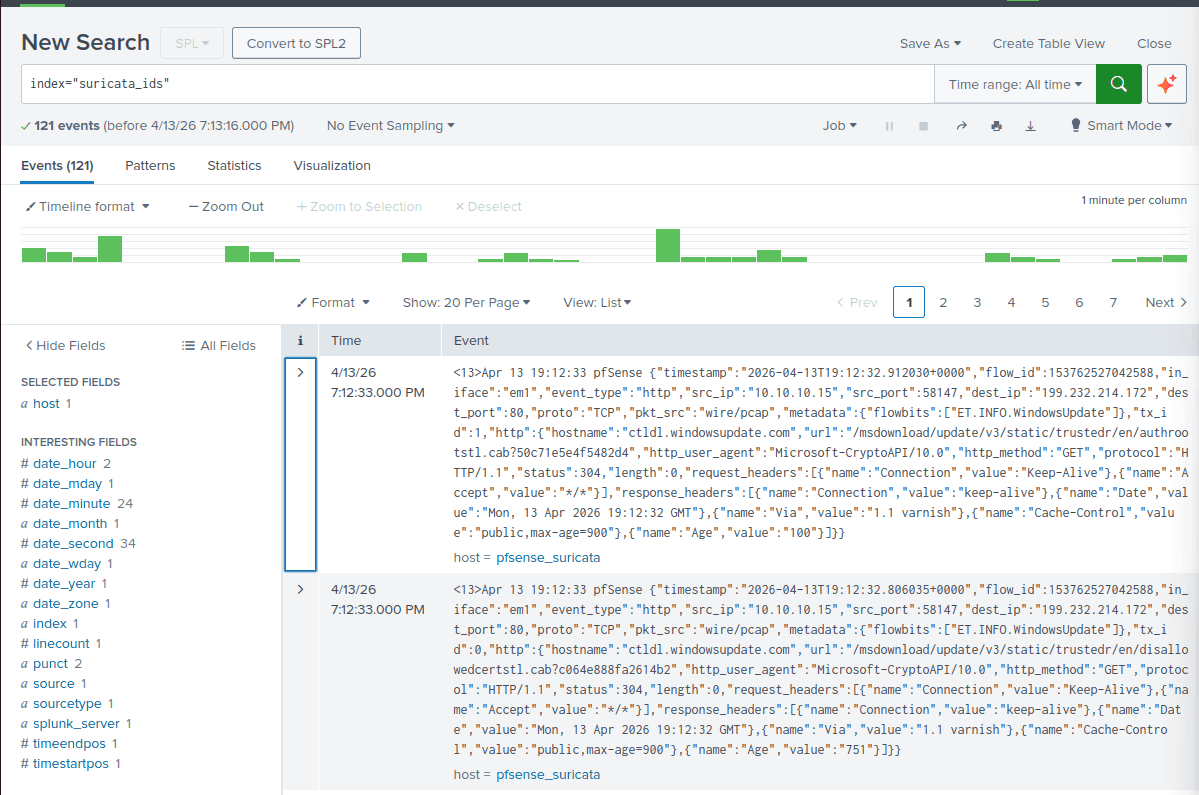
Verification on Splunk:
- Open the Search & Reporting app and run the following SPL query:
index="suricata_ids"
(Results when using TCP port 515)
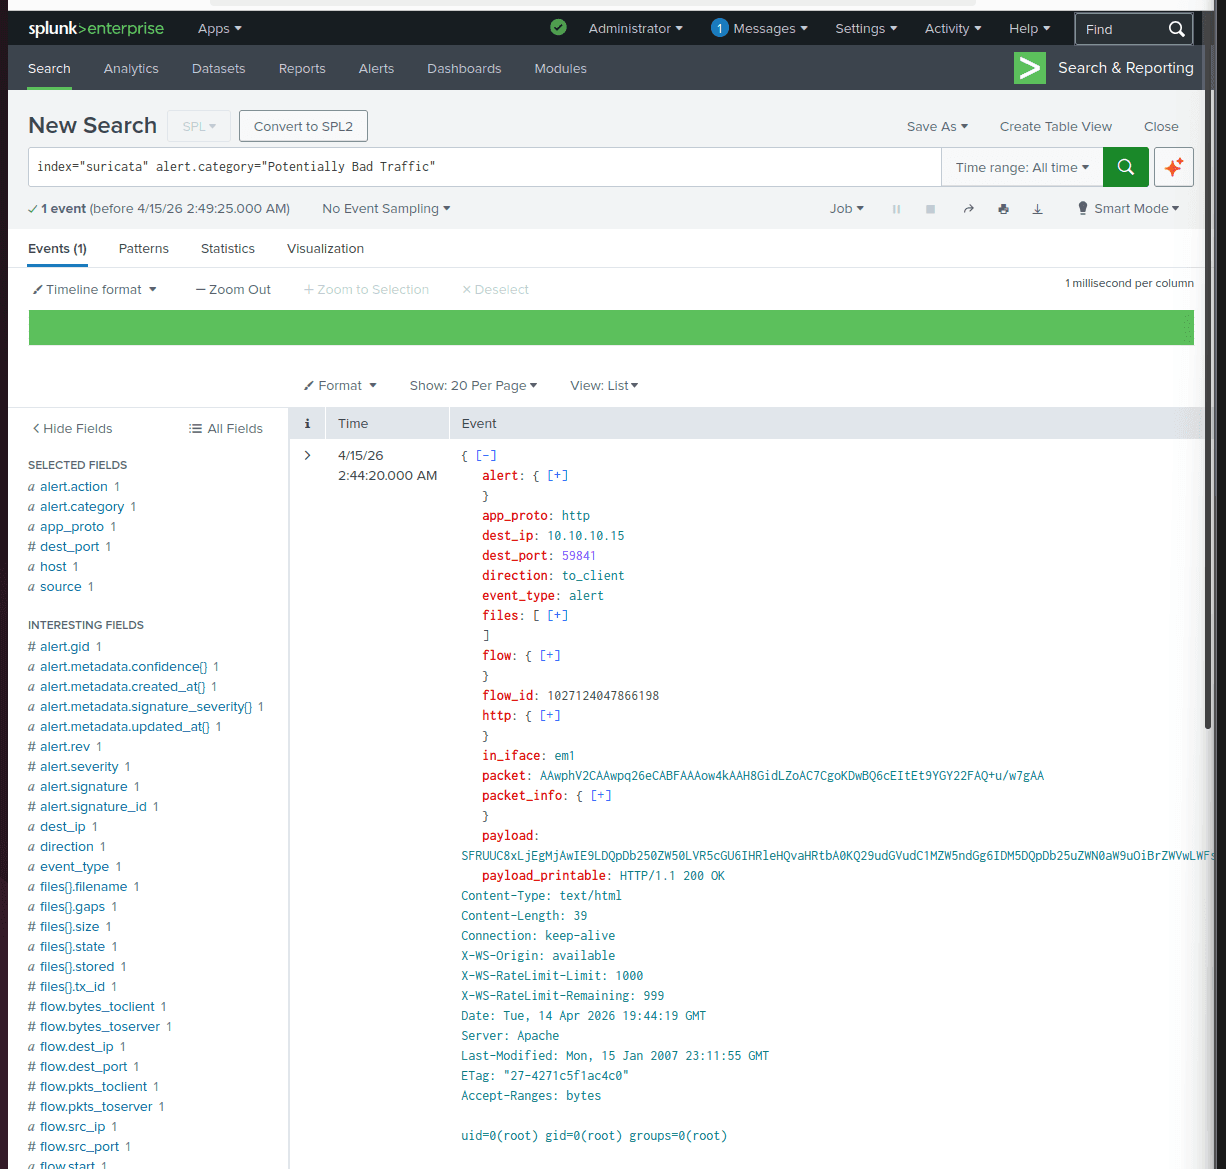
(Results after transitioning to HEC port 8088)
Crucial Note Regarding Timestamps: By default, the system time on pfSense operates in UTC-0, which will cause timestamp discrepancies in your SIEM. You must navigate to System → General Setup and adjust the timezone configuration to Vietnam (Asia/Ho_Chi_Minh) to ensure accurate log correlation.